climatehannah

Blogs about weather and climate from a PhD student

EGU 2016: Part 2 — April 25, 2016

EGU 2016: Part 2

I’m back from a busy week at EGU 2016 in Vienna, an event attended by 13,650 geoscientists from 109 different countries! The size of the event is something I didn’t really appreciate until I was there. After a hectic first day (see EGU 2016: Part 1), the rest of the week continued in a similar fashion. Here are just some of the main highlights.

Tuesday was the day of the ‘Historical Climatology’ session. This was one of the 619 themed sessions at EGU. The sessions are typically broken up into an oral session followed by a poster session. The Historical Climatology oral session contained 6 talks about different uses of historical data sources. These covered studies spanning 5 different continents and showed the broad scope of this very much emerging field. Linden Ashcroft gave a great talk on the use of historical documents to identify extreme precipitation in South East Australia and assessed how they linked to ENSO. Timothy Patterson introduced me to the concept of ‘ice-out’, which is the date the ice disappears from a lake. He focused his research in North East USA, where records of ice-out date stretch back to 1822! The records of ‘ice-out’ dates have even been found on barn doors.

The poster session that evening was where I presented my research. This was the first time I had presented a poster at a conference before and I really enjoyed it. It was great to see people taking an interest in my work and stopping to talk about it.


Throughout the rest of the week I attended quite a few different sessions, as it’s easy to pop in and out of them. This included sessions on the ‘Causes of climate change in the 19th and 20th century’, ‘The global monsoon system’ and ‘Flood and weather extremes of the past’. I was surprised at just how popular some of the talks were, with many session having no empty seats and very little floor space left!

IMG_3511

One of my favourite sessions was ‘Communication and Education in Geoscience: Practice, Research and Reflection’. This Friday morning session was a nice change from some of the more intensive sessions I had been to and contained some really interesting talks. Subjects included: how video games can be used as a tool for communicating volcanic hazards; the development of Geography and Geology Terminology in British Sign Language; some poetry; and a talk about an interesting concept play based on the Climate Change COP agreements. The unsuspecting audience members were turned into delegate members and had to make some important decisions on the future of our planet!

As well as the subject specific sessions, there are a range of other things going on at EGU. The geocinema was a great place to go and escape the busy conference and watch some short films about explorations, research expeditions and the impacts of geoscience on everyday life. I also attended a lunch time session ‘Working at the science policy interface’, which was a panel discussion which included Valerie Masson-Demotte, the co-chair of IPCC working group 1. Overall, the conference was a great experience and I would highly recommend it to other researchers. Over 53% were early career scientists, so great if it’s your first international conference! See more facts and figures on the conference here.

On top of all the conferencing, I had lots of time to explore Vienna too! Its a beautiful city, with grand palaces, museums, and parks. I’ll leave you with a few photos and I’ll head back to working on my PhD! Thanks EGU!


EGU 2016: Part 1 — April 18, 2016

EGU 2016: Part 1

As part of my PhD I am lucky enough to get the opportunity to go to conferences and share my research. I’ve been to a few conferences so far but I am currently attending my first international conference, EGU 2016 in Vienna. The European Geosciences Union General Assembly, EGU for short, is held in Vienna each year and is a meeting of over 13,000 geosciences from around the world. It covers a massive range of topics and is a great mix of different sub-disciplines. For me this is really useful as there are a number of session being held which I am really interested in, and have relevance to my PhD research. This years EGU has 4,863 orals scheduled and over 10,000 posters on display, one of which is my own! Today is Day 1 of the conference and I hope to do a few blogs throughout the week to share my experience here.

I arrived in sunny Vienna yesterday morning having taken a very early flight from a dark and cold Manchester. From Manchester Piccadilly all the way to central Vienna, I had great fun spotting out others going to the conference, quite easy if their hand luggage consisted of a massive poster tube, a bit more difficult if not. I’ve not been to Vienna before, but everything I’ve seen so far points to it being a great destination for a week away from the office! The main EGU schedule runs from Monday to Friday, so Sunday was a nice chance to have a look around the historic city centre, have some ice cream, and take in the views from the top of St. Stephens Cathedral.

IMG_3461

In the evening, EGU held a welcome event at the conference centre. This was a great chance to go to the venue, pick up a program and mingle with the thousands of others who had come along for the event. I would recommend attending the Sunday evening event in future years, the vast amounts of free wine was a nice way to kick off the week.

My Day 1 started with a great session on ENSO: Dynamics, Predictability and Modelling. This session lasted all morning and covered topics from the 2015/16 El Niño to more modelling focused discussions. The room was packed out! My research is focused on historical ENSO, but to hear about the more modern events and the modelling side of things was pretty interesting and gave me a few things to think about when I get back to my work in Sheffield. This afternoon I’m heading to some talks on Flood and Weather extremes of the past and then to check out some of the posters. The poster halls here are massive! Much bigger than the 20 or 30 so posters I’ve seen at the previous conferences I’ve been to. They are pretty overwhelming but I’m hoping a few will catch my eye this afternoon.

Tomorrow I get to present my own work, hidden in the middle of one of these massive poster halls. For anyone at this years event, I’ll be in Poster Hall X3, number 180 from 17:30-19:00. My poster is titled ‘Reconstruction of El Niño Southern Oscillation using data from ships’ logbooks, 1750-1854’. Come along and chat if you want to know more. My poster is attached to the session ‘Historical Climatology’, which has some really intriguing talks in it. The topics cover a range of historical climate data sources including grape harvest dates! This is also on tomorrow (Tuesday) at 10:30 till 12:00 in room -2.47.

Ok, time to go and see some more talks!

IMG_3502


Perks of doing a PhD — April 11, 2016

Perks of doing a PhD

A couple of weeks ago I reached the half way point of the funding of my PhD! Woohoo!

This got me thinking about what I’ve done so far (quite a bit) and what is still left to come (a lot!). Within the past year and a half my idea of what a PhD is and what doing a PhD is like has changed a fair bit. Some of the main unexpected benefits are the things that I have been able to do which aren’t actually the PhD, but that have come up because of doing it. So basically, I’m thinking about all the great things about doing a PhD, and ignoring the actual work of doing a PhD. That’s ok right?! Although in the past few months I’ve been enjoying the researching a lot more too, and will do a blog post on that fairly soon!

So here are my top 5 perks of doing a PhD (not including what my daily life normally looks like…


IMG_0542_1024
…because my love for computers and MATLAB can’t be explained in a blog post).

1. Teaching – I’ve been lucky enough to do a lot of teaching during my PhD so far. It’s such a nice break from sitting at my desk constantly. It’s also a great way to get to learn a lot more about the department as a whole, to work with other members of staff and to meet lots of the undergrads. I’ve taught on a range of courses, from Environmental Change to Atmospheres and Oceans, to more general research skills courses. My favourites so far though have to be the two field classes I’ve helped out on, one in Blencathra, Lake District, last year, and more recently one to sunny Southern Spain. Looking at the photos below you can probably guess why! My advice, if you get the chance give teaching a go during your PhD. If it’s not for you, you don’t have to do it forever. If like me, you find it actually quite fun, then grab the opportunities when you can.


2. Twitter – Yes, I know you don’t have to be doing a PhD to use twitter… but basically, twitter is really useful to keep up to date with what’s going on out there in your research area. I’m not much of an active twitter user (@climate_hannah if you want proof), but I do go on every day and see what the weather and climate news is. I’ve been following ENSO updates on there for the past year. Its good for seeing what other PhD students are saying and really useful to know that there are so many others out there working towards a PhD. Reading just a couple of lines about what they are up to and how hard so many of them seem to be working can be quite motivational (and hopefully not too stalker-like!).

3.Conferences – In my first year I was mostly focused on figuring out what was actually going on with my PhD. Now that I’ve figured out at least a bit of that, I’m keen to get to more conferences and show off some of my results, starting next week with my first major conference, EGU in Vienna. However, I did manage to squeeze a few conferences in last year, the first of which was usefully hosted in my department, the RGS-Mid Term. This was a great first conference, as it was run by and for other postgraduate students. Student conferences are a great place to present your research for the first time. I also presented at RMets Student conference in Birmingham last summer, which you can read all about here.

4.The place and 5. The people – This one totally depends on where you end up. After undergrad, its not always certain that you’ll be staying in one place for at least 3 years again. Starting my PhD I was new to Sheffield. It is really given me a chance to appreciate a new place and get to know lots of people. Academics are an interesting bunch and there are certainly a few interesting characters around. It’s really nice to have found somewhere with a good atmosphere and an office that you want to go and work in. In terms of the place, after one and a half years, I’m still adding more to the list of things to do quicker then they are getting ticked off! Sheffield has a lot more going on then it first seems, and I’m looking forward to getting through the rest of what it has to offer!


Speak Up, for the love of… — June 19, 2015

Speak Up, for the love of…

On Wednesday 17th June, I participated in the UKs biggest ever climate lobby which aimed to raise awareness of the urgent need for action on climate change. It was an opportunity for constituents to explain to their MPs why climate change matters to them. This year is crucial for negotiations of climate change and emissions reductions, cumulating in the UN 2015 Paris Climate Conference at the end of the year.

P1100032This government, which will last until 2020, is positioned to make key decisions over whether we can stop dangerous climate change. A rise in global temperatures of 2oC above pre-industrial levels is often quoted as the threshold for ‘dangerous climate change’, with current emissions trajectories we are heading for a rise of around 5oC. Therefore there is a need for drastic action to cut emissions so we do not commit ourselves to such a large temperature rise, which will have costly consequences globally. A powerful message comes from Naomi Klein’s recent book on climate change ‘ This Changes Everything’, ‘The International Energy Agency warns that if we do not get our emissions under control by a rather terrifying 2017, our fossil fuel economy will lock-in extremely dangerous warming ‘the energy related infrastructure then in place will generate all the CO2 emissions allowed’ in our carbon budget for limiting warming to 2 degrees – ‘ leaving no room for additional power plants, factories and other infrastructure unless they are zero-carbon’… The door to reach 2 degrees is about to close. In 2017 it will be closed forever… We either change now or lose our chance’.

The event in London was organised by The Climate Coalition, and over 9000 people from across the UK met in Westminster and lobbied over 330 MPs. More about the event can be found here: http://fortheloveof.org.uk/the-best-of-speak-up/

As suggested we made bunting which voiced our key concerns about climate change and important things that are under threat. This included; Island nations under threat from sea level rise, the rise in extreme weather events, The Arctic, lakes and rivers, bees, beaches and food security.

IMG_1325

Bunting to show our key concerns about climate change 

We met with Sharon Hodgson, Labour MP for Washington and Sunderland West, on the terrace of the Houses of Parliament. We talked for almost an hour and voiced our key concerns.

P1100040

Meeting our MP Sharon Hodgson 

Key points we discussed include;

  • Climate justice – My key concerns surrounding climate change are for the vulnerable island nations and low-lying areas which are at threat of losing their homes due to sea level rise, as well as communities at risk from an increase in extreme weather events. The majority of populations which will experience the more immediate impacts of climate change are developing nations, whereas the majority of historical emissions are from developed countries. There is a need for social justice due to the unequal burdens created by climate change. It is the responsibility of countries like the UK to drive drastic emissions reductions and to invest in renewable energies, as well as providing financial aid to countries under more immediate threat from the impacts of climate change. It is hoped that this will be considered and acted upon in a just and fair way during the UN talks in Paris.
  • Renewable Energy Transition – The North East has huge potential in the development of renewable energies, a sector that could bring investment and employment to the region, as well as helping to cut greenhouse gas emissions. Sharon supported the idea of an increase in solar panels and wind farms in the region. She also informed us of the plan for an ‘International Advanced Manufacturing Park’ in the region which could include alternative fuel technologies such as electric vehicles, as well as offshore and renewable energy sectors.
  • Fracking – Next week (23rd June) Lancashire County Council will make a key decision on whether oil and gas company Cuadrilla can go ahead with fracking at two sites in Lancashire. If this passes, it will be the first approved case for fracking in England. Fracking has been suspended in Scotland and Wales while the health, environment and climate change risks are assessed. It has also been banned in France since 2011. If all the known conventional fossil fuels that are still in the ground are used, the emissions and consequences of using them would lead to dangerous climate change, therefore it is not necessary to exploit these unconventional methods of fossil fuel extraction. Investments in new energy sources should focus on renewables. We urged Sharon to sign the ‘Frack Free Promise’ to oppose fracking in the constituency and nationwide (https://secure.greenpeace.org.uk/page/content/fracking-signup/)
  • Local solutions – Bringing sustainable transport solutions to the constituency presents an opportunity to combat emissions reductions at a local level. Sharon actively supports bringing the Metro to Washington, a large population without rail transport. She has a petition on her website and has presented a case for the development of the metro in parliament numerous times (http://www.sharonhodgson.org/washington_metro_petition). By adding the argument that the metro would help combat climate change in the region and promote more sustainable transport, Sharon recognised that the campaign could get additional backing. We urged Sharon to consider that climate change can be worked into other agendas and should always be considered when making political decisions.
  • The urgent need to raise climate change on the political agenda – The time to act is now; this government will essentially decide whether we commit ourselves to dangerous levels of climate change.

It is hoped that climate change will be increasingly considered by politicians in the run up to global talks in Paris in December and that everyone will become more aware of the need to act sooner rather than later.

Onset of Indian Summer Monsoon Declared — June 5, 2015

Onset of Indian Summer Monsoon Declared

Onset of Monsoon Declared

Today (5th June), India’s Meteorological Department (IMD) issued a press release declaring the onset of the southwest monsoon over the Southern State of Kerala. Kerala is the location officially used for the declaration of the onset of the Indian Summer Monsoon. The monsoon then advances northwards across the country, with monsoon not typically hitting the most northern parts of India until later in the month.

What is the monsoon?

Monsoons are a key driver of annual climate regimes in many tropical regions. Monsoon climates are characterised by the seasonal reversal of winds which lead to distinct wet and dry seasons. The Indian Summer Monsoon is one of the main monsoon systems and it has a huge impact of billions of people. The rainfall is vital for agriculture and brings great relief from the heat and aridity of the dry season. The average date for the onset of monsoon over Kerala is June 1st, making this current declaration 4 days later than normal. The IMD map below shows the typical progression of the monsoon over India, indicated in red, as well as the 2015 actual progression, as observed so far, in green. The location of Kerala can be seen in the South West tip of India. As the monsoon progresses, the advance of the 2015 monsoon will be recorded and mapped.

mon-prog

 How does the declaration come about?

Guidelines for the declaration of monsoon onset over Kerala are focused on three key weather variables; Rainfall, Winds and Cloudiness.

  • The past two days have seen rainfall of over 2.5 mm in 70% of the 14 designated stations for reporting rainfall in Kerala.
  • A westerly/west-southwesterly wind in lowest 4.5 km of the atmosphere over the south Arabian Sea.
  • Increased cloudiness, measured by the amount of Outgoing Longwave Radiation over a pre-defined area to the South West of India.

As these three conditions have been observed over the past two days the IMD could officially declare the onset of monsoon.

Why this is important?

This year, India has also experienced an extreme heat wave prior to the onset of the monsoon, with temperatures reaching 48oC. Although the weeks leading up to monsoon are commonly the warmest of the year over much of India, this years heat wave has been more extreme than normal and resulted in around 2,000 fatalities. Water shortages and power cuts have made the unbearable conditions during the heat wave even worse. The monsoon and its rainfall will provide some welcome relief to the extreme conditions.

See IMD Press Release: http://www.imd.gov.in/section/nhac/dynamic/pressrelease_nwfc.pdf

El Niño: What’s all the fuss about? — May 14, 2015

El Niño: What’s all the fuss about?

El Niño: What’s all the fuss about?

Just a couple of weeks ago I was helping out on a undergraduate course where we looked online to assess the current state of El Niño and its forecast for the year ahead. Conditions and forecasts issued by US scientists at the National Oceanic and Atmospheric Administration (NOAA) in March 2015 were currently up and they were suggesting we were in a ‘weak El Niño’. This was declared because observations suggested that sea surface temperatures (SSTs) over a key region of the Pacific Ocean were higher than normal and the atmosphere was also starting to kick into El Niño conditions. This led to an ‘El Niño advisory’ being issued on March 5th.

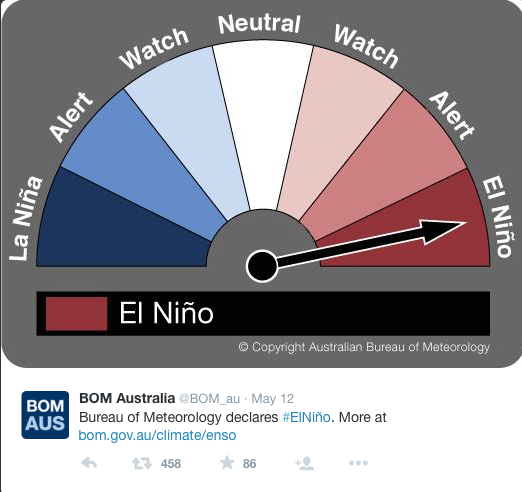
On the 12th May 2015, it was the turn of the Bureau of Meteorology in Australia to officially announce that we had entered an El Niño. They suggested that this El Niño has potential to be a ‘substantial’ event. This was announced via their website and on Twitter, with the following post showing that their ENSO tracker had been moved to El Niño;

BoM

As a result of this announcement, numerous news articles were published from around the globe, warning people of El Niño and postulating the range of implications this may have on our weather world-wide. It seems that public interest in El Niño increased rapidly, with the term ‘El Niño’ being the 4th most searched for term on Google in the UK the day following the announcement, with over 10,000 searches, shown in this daily summary from Google trends website:

googletrend1

What is this El Niño? What does it mean for us and the rest of the world? How will it affect the weather? These are all questions addressed by the flurry of news reports published over the last few days.

Here is a quick summary of the answers to these questions based my own understanding as well as from numerous articles, interviews and videos published by the media over the past few days.

This BBC video (http://www.bbc.co.uk/weather/feeds/29559386) nicely summarizes El Niño, which is essentially an abnormal warming of the tropical Pacific Ocean which leads to altered weather patterns around the globe. It is a naturally occurring phenomenon which appears every 2 to 7 years. All El Niño events are different but there are typical weather conditions that become more likely during an El Niño. The impacts of El Niño are centered over the Pacific, but it has implications for weather patterns around the globe. Here are some of the impacts typical of El Niño events:

  •  Drier conditions over Australia, Indonesia and India which can lead to wildfires, smog and lower crop production.
  • Increased precipitation over regions of South America and the Eastern Pacific leading to flooding and landslides.
  • Weaker than normal Indian Monsoon causes drought which can vastly reduce crop yields. El Niño causes uncertainty in the predictions of crop yields leading to fluctuations in agricultural commodities markets.
  • El Niño can affect the position of the North Atlantic jet stream, a key driver of weather in the UK. A more southerly jet stream, thought to be more common during El Niño, can lead to cooler winters. However the links between El Niño and weather patterns is stronger in regions closer to the Pacific, and additional factors influencing the UK weather mean the effect of El Niño is less clear in the UK than in other regions.
  • As I found out whilst doing my undergraduate dissertation, El Niño is bad news for skiers in Pacific Coast Canada, with ski resorts in Vancouver and Whistler often suffering during El Niño due to warmer winter conditions resulting in less snowfall. This was an issue for the 2010 Winter Olympics held in Vancouver, when El Niño conditions contributed to poor snow coverage on Vancouver’s North Shore Mountains. Extra snow had to be transported in from colder regions in the province.
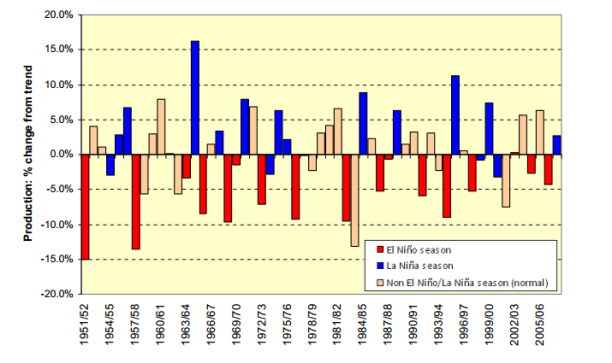
  • El Niño can also have an effect on the worldwide production of cocoa! The graph below from the International Cocoa Organization’s 2010 report shows that in many recent El Niño years (indicated in red), the annual production of cocoa worldwide was reduced.

cocoa production.jpeg

These are just some of the impacts certain El Niño events have had in the past which give an idea of what we might expect if this El Niño event develops over the next few months and into the winter.

So how do we know what El Niño will do over the next year?

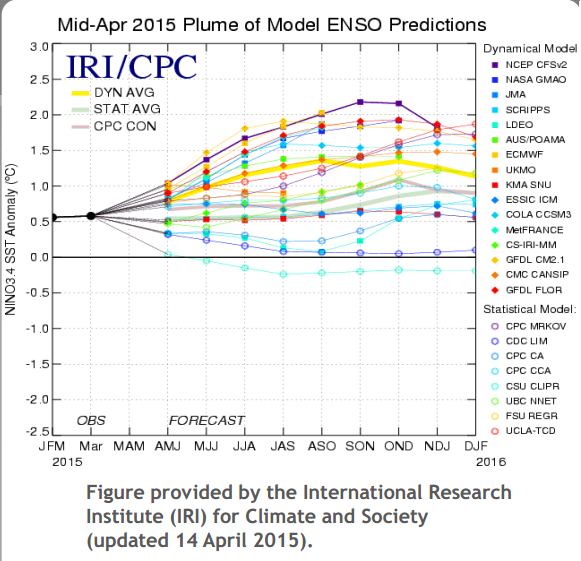
A range of climate models and statistical techniques are used to forecast the future of El Niño. Here is the most recent forecast from the International Research Institute for Climate and Society, taken from NOAA’s ENSO bulletin. It shows the range of projected sea surface temperature (SST) anomalies in a key region (NINO 3.4) of the equatorial Pacific which experiences warm anomalies during El Niño. The two black dots shows recent observations of SST’s, with SSTs being warmer than normal already and this warming expected to increase over the next few months in most of the models. However, the forecasts on the graph show there is still a lot of uncertainty over which path the El Niño event may take, with some of the projections suggesting that SSTs might reach over 2 degrees warmer than normal, while others suggest the warming of the ocean in this region may actually cool. Therefore there is still uncertainty on how strong this El Niño event might be and how large its impacts might be.

2015 forecast1

This post (http://www.climate.gov/news-features/blogs/enso/spring-predictability-barrier-we’d-rather-be-spring-break) from Michelle L’Heureux, a scientist at NOAA, explains the so-called ‘spring predictability barrier’, which means that El Niño forecasts made in Northern Hemisphere spring time are less accurate than those published at other times of the year. Therefore additional caution is needed when looking at these spring-based forecasts.

seasonal allergies

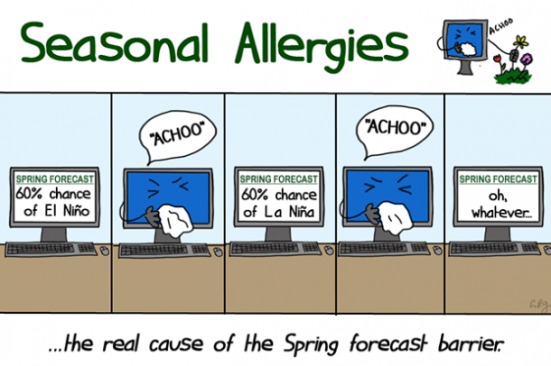
Illustration by Emily Greenhalgh, NOAA Climate.gov.

An example of the uncertainty in forecasts published at this time of year can be seen when looking at the forecast from last year. Below is the forecast from Mid-April 2014, when warmer SSTs were predicted in the key tropical Pacific region suggesting a move into El Niño conditions. However, observations throughout the year showed that this failed to result in El Niño conditions last year.

2014 forecast

Some news articles are picking up on this point, and highlighting caution after 2014’s ‘false alarm’. So how is this year different to last year? We already have warm SSTs over the Pacific, whereas last year the waters in this key El Niño region were cooler than normal. This could be a key factor which will lead to this year’s El Niño developing further. However the main thing to remember is that the ability of models to forecast El Niño is low in the spring months, so as we progress into summer the forecasts for El Niño will become less uncertain and we will have a better idea of how this El Niño event might unfold and how strong an event it may be.

To keep up to date with the development of this El Niño over the next few months the following two websites are good places to start:

Australian government’s Bureau of Meteorology, next updated on 26th May http://www.bom.gov.au/climate/enso/

&

ENSO Diagnostics Bulletin by NOAAs Climate Prediction Centre http://www.cpc.ncep.noaa.gov/products/analysis_monitoring/enso_advisory/ which issues weekly and monthly information on the current state of El Niño.

I will be using this blog to post about interesting climate and weather related things I come across as part of my PhD research which is focused on El Niño and historical climate variability. So no doubt El Niño will be popping up again. Hope to see you again soon!

Links to some of the interesting sources used and referenced:

Useful BBC resources: